30-Minute Network Performance Monitor With Cloud Servers From Packet
Ever need to track the performance of your internet connection in a pinch? I did the other day when a customer we installed DIA services for complained of poor performance. I’ve tried many schemes in the past to do this kind of testing and this time I wanted to do something new. I also wanted to use packet.com, because I was curious about their services.
In my case the client had purchased a 1Gbps DIA circuit which we brokered with a tier 1 carrier. He emailed about a week after installation with concerns about performance. This is his primary circuit, with a redundant gigabit link from a lesser known local carrier. He said he had been testing with speedtest.net and getting results anywhere from 900Mbit/s to as low as 54Mbit/s. Of course we all know that speedtest.net isn’t a perfect test.
For one we have no knowledge of the underlying networks or servers. We don’t know if they’re on slow connections at some tiny ISP or directly on a major carrier’s network. For example I get excellent speeds at speedtest.net from my home internet connection. The server they suggest is literally down the road somewhere, it’s owned by my home ISP:
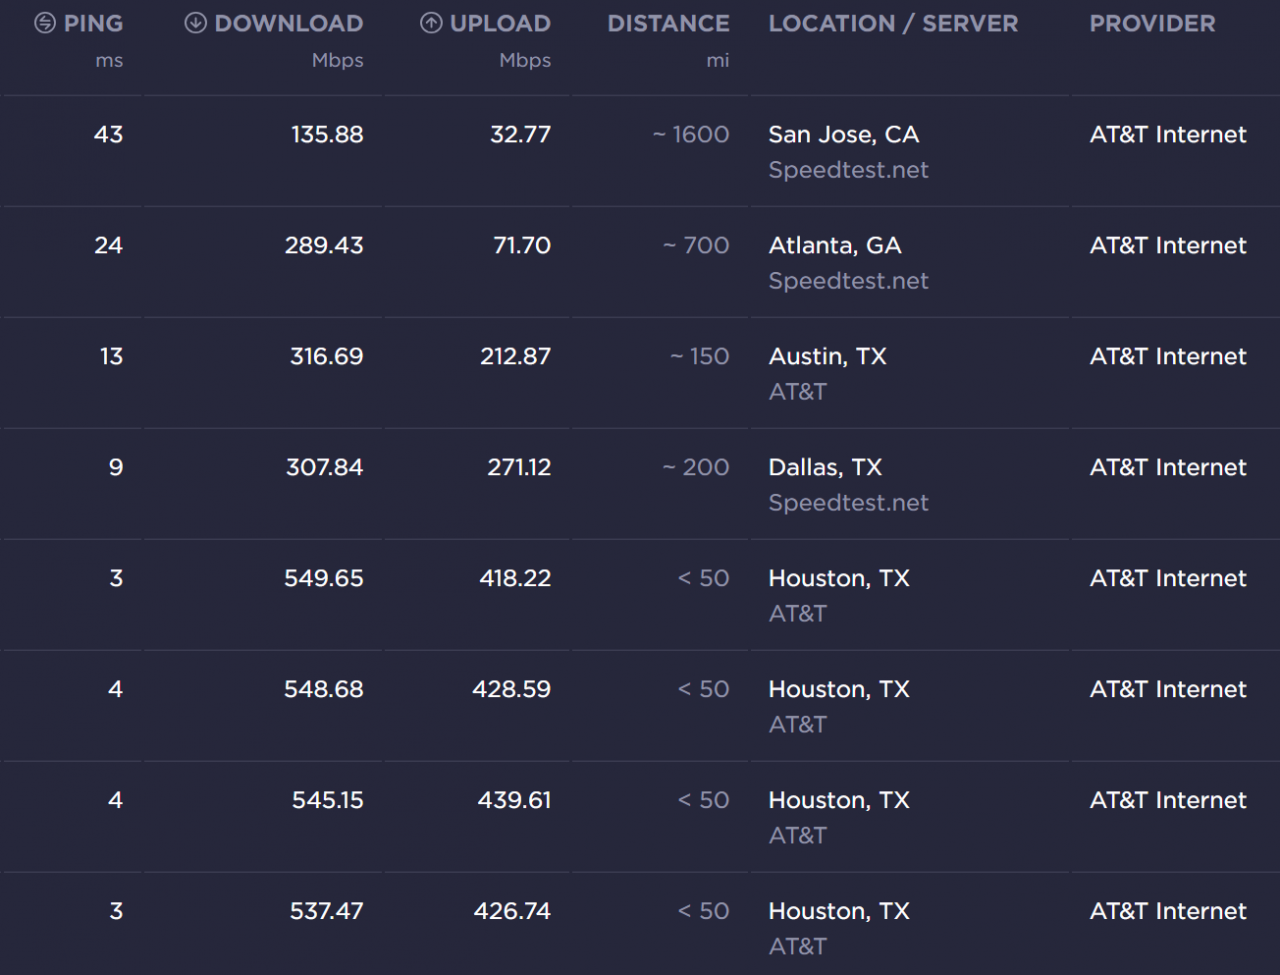
See how great the speeds were when I started testing? By the time I got to tests in San Jose, CA the speeds really took a dip. Ultimately performance depends on the networks and routing that exist at and between you and the server hosting the content. So when a user or customer says “my internet is slow” how do we figure out where the issue is? If we just call the ISP they will likely say it’s not their problem. The customer may be trying to reach a specific service that has congestion on their end or in the middle.
So how can we prove and test if the ISP is really to blame? Well we could open a bunch of speedtest.net tabs and pick a ton of locations to test. Then we could sit and click forever and log data until we have a pattern. However, I think we can do better than that.

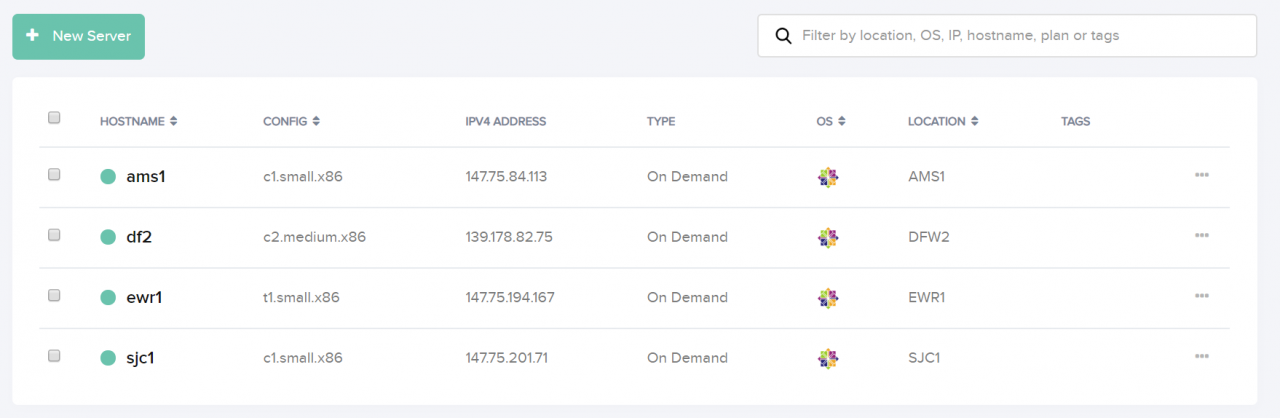
I started out by making an account at packet.com. I would use their bare metal cloud servers to host my test nodes. I created four CentOS 7.x nodes. One in Sunnyvale, CA, another in Dallas, TX, the third in Newark, NJ and the last in Amsterdam in the Netherlands. Between those diverse locations I can show issues related to the ISP’s performance.
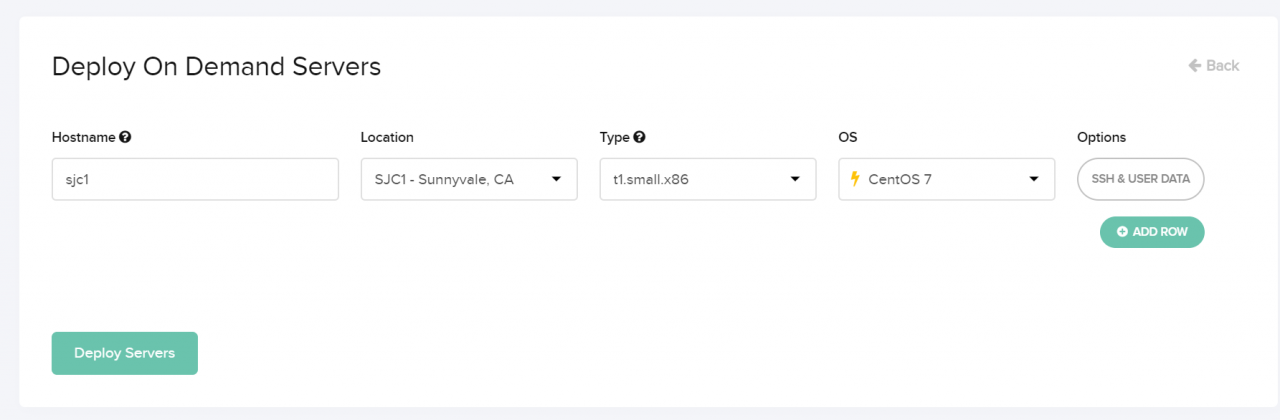
If you’re lucky enough, all regions will have t1.small.x86 nodes, you don’t need any more than that for this test! As of writing these, those nodes are just $0.07 / hour! My friend who works at packet confirmed even those have 2x 10Gbps connections. Unfortunately I couldn’t get all t1.small.x86 nodes, because of availability. I had to get a few expensive ones.
I made sure to include my client server’s SSH key in each install. Once all the boxes were up the rest was really pretty simple. I jumped on my client’s server behind his poorly performing DIA circuit. I setup hosts entries for each of the test nodes on packet.com’s side to make addressing them easier. I didn’t feel like setting up real DNS records.
[root@bfdstgp0001 ~]# cat /etc/hosts
127.0.0.1   localhost localhost.localdomain localhost4 localhost4.localdomain4
::1         localhost localhost.localdomain localhost6 localhost6.localdomain6
147.75.84.113 ams1
139.178.82.75 dfw1
147.75.194.167 ewr1
147.75.201.71 sjc1
[root@bfdstgp0001 ~]#
Then I simply SSH’d over to each of the hosts. First I just updated them and gave them a reboot, packet.com’s images are a little out of date. There were quite a few updates.
[root@bfdstgp0001 ~]# ssh ams1
[root@ams1 ~]# yum update
...
[root@ams1 ~]# reboot
[root@bfdstgp0001 ~]# ssh dfw1
[root@df2 ~]# yum update
...
[root@df2 ~]# reboot
[root@bfdstgp0001 ~]# ssh ewr1
[root@ewr1 ~]# yum update
...
[root@ewr1 ~]# reboot
[root@bfdstgp0001 ~]# ssh sjc1
[root@sjc1 ~]# yum update
...
[root@sjc1 ~]# reboot
Once my hosts were all up to date and back from reboots I started to setup test targets. First I installed Apache, set it up to start automatically, and started it. Then I generated a 20MB test file with ‘dd’ to use for our tests.
[root@ams1 ~]# yum -y install httpd
Loaded plugins: fastestmirror
Loading mirror speeds from cached hostfile
...
[root@ams1 ~]# systemctl enable httpd
[root@ams1 ~]# systemctl start httpd
[root@ams1 ~]# dd if=/dev/zero of=/var/www/html/test count=10000 bs=2k
10000+0 records in
10000+0 records out
20480000 bytes (20 MB) copied, 0.0332388 s, 616 MB/s
[root@ams1 ~]# exit
logout
Connection to ams1 closed.
[root@bfdstgp0001 ~]#
How easy is that? I did that on each server, took just a few minutes. As you can see I had ‘dd’ output the file to /var/www/html/test. This will make the file available via HTTP protocol from my customer’s server. It would be reachable via http://ams1/test and similar urls for the other servers.
Now here is a slightly harder part. Back on my customer’s server i started writing a script. For ease, as this is a new environment I just kept everything in /root/ and worked with two files, speed.bash and speed.log. I like to use nano as my editor, but you can use whatever you would like:
[root@bfdstgp0001 ~]# nano -w /root/speed.bash
In our new script I wanted to setup all our hosts in an array and a main infinite loop that sleeps for 300 seconds (5 minutes) at a time.
#!/bin/bash
SERVERS=("ams1" "dfw1" "ewr1" "sjc1");
while :
do
        # Here is the main loop!
        sleep 300
done
Next I figured we should create some kind of timestamp that is set for every iteration of the main 5 minute loop. Furthermore I wanted to loop through each of the hosts inside that loop so that we could perform per-host speed tests. We can put the following code into the main loop, above the sleep statement.
TSDATE=`date "+%Y-%m-%d %H-%M"`
for i in "${SERVERS[@]}"
do
        # Here is the first inner for loop!
done
Now we have a main infinite loop with a 5 minute iteration and our first inner loop which cycles through each host as fast as possible, but one at a time. Inside this loop we will build the meat of our code. First we need a way to grab our file. I’m just going to use wget, you can install it by running the following command.
[root@bfdstgp0001 ~]# yum -y install wget
Loaded plugins: fastestmirror
Loading mirror speeds from cached hostfile
 * base: mirror.cs.pitt.edu
...
[root@bfdstgp0001 ~]#
Now we also need to store our output into a variable and output it along with the hostname. This is also pretty easy. This code goes inside the first inner loop. We will also delete the temporary file we made.
RATE=`wget -O /tmp/speedtest http://$i/test 2>&1 | grep "saved \[" | awk '{print $3}' | cut -d \( -f 2`
echo "$TSDATE, $i, $RATE"
rm -f /tmp/speedtest
The interesting part here is what we are doing to get our RATE variable. We execute the wget command with the -O flag. This outputs to the destination of our choice, in this case /tmp/speedtest. Then we specify that we want to download http://$i/test which will replace $i with the name of each host as the loop iterates.
2019-02-20 23:43:31 (2.56 MB/s) - ‘test’ saved [20480000/20480000]
Finally we create a long string of ‘awk’, ‘grep’ and ‘cut’ commands to isolate the message when the wget finishes. It contains the average speed. The awk command grabs the third field, in our case “(2.56”. Then the cut command finds the “(” and prints the “2.56” after it as the second field. Boom our RATE variable now contains 2.56, the average speed of our wget.
#!/bin/bash
SERVERS=("ams1" "dfw1" "ewr1" "sjc1");
while :
do
        TSDATE=`date "+%Y-%m-%d %H-%M"`
        for i in "${SERVERS[@]}"
        do
                RATE=`wget -O /tmp/speedtest http://$i/test 2>&1 | grep "saved \[" | awk '{print $3}' | cut -d \( -f 2`
                echo "$TSDATE, $i, $RATE"
                rm -f /tmp/speedtest
        done
        sleep 300
done
Our code should look like the above. Below you can see how it executes:
[root@bfdstgp0001 ~]# chmod +x speed.bash
[root@bfdstgp0001 ~]# ./speed.bash
2019-02-20 23-45, ams1, 2.57
2019-02-20 23-45, dfw1, 1.91
2019-02-20 23-45, ewr1, 3.23
2019-02-20 23-45, sjc1, 1.32
^C
[root@bfdstgp0001 ~]#
I broke the loop with “CTRL+C” to interrupt the infinite loop. As you can see I chose to output in a CSV style format, for ingestion into a database or spreadsheet later. We could stop here, but let’s think. Do browsers really work this way? Do most things users experience pull just one HTTP thread? Well in reality no, browsers generally make a ton of concurrent requests to really max out performance. We could simulate this with forked threads.
There are cleaner ways to write a program like this, but I was enjoying a beer and wanting to knock it out real quick. I tore out the entire content of the first inner loop and decided I would create eight threads. First I wanted to setup the wget processes and record their process IDs. This code went right into the first inner loop.
wget -O /tmp/st1 http://$i/test 2>&1 | grep "saved \[" | awk '{print $3}' | cut -d \( -f 2 > /tmp/sr1 &
PROCID1="$!"
wget -O /tmp/st2 http://$i/test 2>&1 | grep "saved \[" | awk '{print $3}' | cut -d \( -f 2 > /tmp/sr2 &
PROCID2="$!"
wget -O /tmp/st3 http://$i/test 2>&1 | grep "saved \[" | awk '{print $3}' | cut -d \( -f 2 > /tmp/sr3 &
PROCID3="$!"
wget -O /tmp/st4 http://$i/test 2>&1 | grep "saved \[" | awk '{print $3}' | cut -d \( -f 2 > /tmp/sr4 &
PROCID4="$!"
wget -O /tmp/st5 http://$i/test 2>&1 | grep "saved \[" | awk '{print $3}' | cut -d \( -f 2 > /tmp/sr5 &
PROCID5="$!"
wget -O /tmp/st6 http://$i/test 2>&1 | grep "saved \[" | awk '{print $3}' | cut -d \( -f 2 > /tmp/sr6 &
PROCID6="$!"
wget -O /tmp/st7 http://$i/test 2>&1 | grep "saved \[" | awk '{print $3}' | cut -d \( -f 2 > /tmp/sr7 &
PROCID7="$!"
wget -O /tmp/st8 http://$i/test 2>&1 | grep "saved \[" | awk '{print $3}' | cut -d \( -f 2 > /tmp/sr8 &
PROCID8="$!"
As you can see I literally just copy pasted 8x instances of a wget command, where I’m saving our test downloads as separate files /tmp/st1, /tmp/st2, etc… and I’m outputting average speed that used to go to a RATE variable into a file /tmp/sr1, /tmp/sr2, etc… You can see the ampersand (&) at the end of each command which forks it into a separate process. I’m also saving the process ID after each fork with PROCID1=”$!”, PROCID2=”$!”, and so on.
Now we need some way of marshalling our forked processes. We can’t just let the loop run as is, it would fork processes as fast as possible. It would amount to an attempt to fork bomb the server. Here was my ugly solution that I plopped right after the last wget fork:
while :
do
        if ! kill -0 "$PROCID1" >/dev/null 2>&1; then
                PROCID1=0
        fi
        if ! kill -0 "$PROCID2" >/dev/null 2>&1; then
                PROCID2=0
        fi
        if ! kill -0 "$PROCID3" >/dev/null 2>&1; then
                PROCID3=0
        fi
        if ! kill -0 "$PROCID4" >/dev/null 2>&1; then
                PROCID4=0
        fi
        if ! kill -0 "$PROCID5" >/dev/null 2>&1; then
                PROCID5=0
        fi
        if ! kill -0 "$PROCID6" >/dev/null 2>&1; then
                PROCID6=0
        fi
        if ! kill -0 "$PROCID7" >/dev/null 2>&1; then
                PROCID7=0
        fi
        if ! kill -0 "$PROCID8" >/dev/null 2>&1; then
                PROCID8=0
        fi
        if [[ $PROCID1 == 0 ]] && [[ $PROCID2 == 0 ]] && [[ $PROCID3 == 0 ]] && [[ $PROCID4 == 0 ]] && [[ $PROCID5 == 0 ]] && [[ $PROCID6 == 0 ]] && [[ $PROCID7 == 0 ]] && [[ $PROCID8 == 0 ]]; then
                break
        fi
sleep 1
done
You can see we just made our own second inner loop. It’s also an infinite loop. We have an infinite loop inside an infinite loop, but don’t worry it shouldn’t run forever! This could all be done with arrays and really much cleaner, but remember, beer and me wanting to do this as fast as possible. I’m not writing an application that I plan to sell here.
The first thing this loop does is check if the process ID of the forked process from earlier is still alive. If not it sets it to zero. It then checks the next process ID, all the way through 8. God this code is dumb and ugly.
Once it gets to the end we do a simple check for each process id, to see if they all equal zero. Once they are all zero we know the forks have all completed. We then issue a “break” to exit out of our second inner loop. If some threads are still alive we simply iterate again after sleeping for one second.
We are almost done. All we need to do is add some code to read our recorded speeds, combine them, output our data in CSV format, and clean up all the stale files.
RATE1=`cat /tmp/sr1`
RATE2=`cat /tmp/sr2`
RATE3=`cat /tmp/sr3`
RATE4=`cat /tmp/sr4`
RATE5=`cat /tmp/sr5`
RATE6=`cat /tmp/sr6`
RATE7=`cat /tmp/sr7`
RATE8=`cat /tmp/sr8`

TRATE=$(awk "BEGIN {print $RATE1+$RATE2+$RATE3+$RATE4+$RATE5+$RATE6+$RATE7+$RATE8; exit}")

echo "$TSDATE, $i, $TRATE"

rm -f /tmp/st1 /tmp/st2 /tmp/st3 /tmp/st4 /tmp/sr1 /tmp/sr2 /tmp/sr3 /tmp/sr4
rm -f /tmp/st5 /tmp/st6 /tmp/st7 /tmp/st8 /tmp/sr5 /tmp/sr6 /tmp/sr7 /tmp/sr8
Super simple, we first set the RATE1 through RATE8 variables to the values found inside /tmp/sr1 through /tmp/sr8 files. The TRATE variable is then used to calculate the total speed of the combined threads. You can see I used awk here, because we’re dealing with floating point values, not integers. Finally we echo out in CSV format and then just use ‘rm’ to clean up!
Here is what your code should finally look like and how it should run:
[root@bfdstgp0001 ~]# cat speed.bash
#!/bin/bash
SERVERS=("ams1" "dfw1" "ewr1" "sjc1");
while :
do
        TSDATE=`date "+%Y-%m-%d %H-%M"`
        for i in "${SERVERS[@]}"
        do
                wget -O /tmp/st1 http://$i/test 2>&1 | grep "saved \[" | awk '{print $3}' | cut -d \( -f 2 > /tmp/sr1 &
                PROCID1="$!"
                wget -O /tmp/st2 http://$i/test 2>&1 | grep "saved \[" | awk '{print $3}' | cut -d \( -f 2 > /tmp/sr2 &
                PROCID2="$!"
                wget -O /tmp/st3 http://$i/test 2>&1 | grep "saved \[" | awk '{print $3}' | cut -d \( -f 2 > /tmp/sr3 &
                PROCID3="$!"
                wget -O /tmp/st4 http://$i/test 2>&1 | grep "saved \[" | awk '{print $3}' | cut -d \( -f 2 > /tmp/sr4 &
                PROCID4="$!"
                wget -O /tmp/st5 http://$i/test 2>&1 | grep "saved \[" | awk '{print $3}' | cut -d \( -f 2 > /tmp/sr5 &
                PROCID5="$!"
                wget -O /tmp/st6 http://$i/test 2>&1 | grep "saved \[" | awk '{print $3}' | cut -d \( -f 2 > /tmp/sr6 &
                PROCID6="$!"
                wget -O /tmp/st7 http://$i/test 2>&1 | grep "saved \[" | awk '{print $3}' | cut -d \( -f 2 > /tmp/sr7 &
                PROCID7="$!"
                wget -O /tmp/st8 http://$i/test 2>&1 | grep "saved \[" | awk '{print $3}' | cut -d \( -f 2 > /tmp/sr8 &
                PROCID8="$!"

                while :
                do
                        if ! kill -0 "$PROCID1" >/dev/null 2>&1; then
                                PROCID1=0
                        fi
                        if ! kill -0 "$PROCID2" >/dev/null 2>&1; then
                                PROCID2=0
                        fi
                        if ! kill -0 "$PROCID3" >/dev/null 2>&1; then
                                PROCID3=0
                        fi
                        if ! kill -0 "$PROCID4" >/dev/null 2>&1; then
                                PROCID4=0
                        fi
                        if ! kill -0 "$PROCID5" >/dev/null 2>&1; then
                                PROCID5=0
                        fi
                        if ! kill -0 "$PROCID6" >/dev/null 2>&1; then
                                PROCID6=0
                        fi
                        if ! kill -0 "$PROCID7" >/dev/null 2>&1; then
                                PROCID7=0
                        fi
                        if ! kill -0 "$PROCID8" >/dev/null 2>&1; then
                                PROCID8=0
                        fi
                        if [[ $PROCID1 == 0 ]] && [[ $PROCID2 == 0 ]] && [[ $PROCID3 == 0 ]] && [[ $PROCID4 == 0 ]] && [[ $PROCID5 == 0 ]] && [[ $PROCID6 == 0 ]] && [[ $PROCID7 == 0 ]] && [[ $PROCID8 == 0 ]]; then
                                break
                        fi
                sleep 1
                done

                RATE1=`cat /tmp/sr1`
                RATE2=`cat /tmp/sr2`
                RATE3=`cat /tmp/sr3`
                RATE4=`cat /tmp/sr4`
                RATE5=`cat /tmp/sr5`
                RATE6=`cat /tmp/sr6`
                RATE7=`cat /tmp/sr7`
                RATE8=`cat /tmp/sr8`

                TRATE=$(awk "BEGIN {print $RATE1+$RATE2+$RATE3+$RATE4+$RATE5+$RATE6+$RATE7+$RATE8; exit}")

                echo "$TSDATE, $i, $TRATE"

                rm -f /tmp/st1 /tmp/st2 /tmp/st3 /tmp/st4 /tmp/sr1 /tmp/sr2 /tmp/sr3 /tmp/sr4
                rm -f /tmp/st5 /tmp/st6 /tmp/st7 /tmp/st8 /tmp/sr5 /tmp/sr6 /tmp/sr7 /tmp/sr8
        done
        sleep 300
done
[root@bfdstgp0001 ~]#
[root@bfdstgp0001 ~]# ./speed.bash
2019-02-21 00-00, ams1, 20.41
2019-02-21 00-00, dfw1, 16.24
2019-02-21 00-00, ewr1, 25.11
2019-02-21 00-00, sjc1, 14.12
^C
[root@bfdstgp0001 ~]#
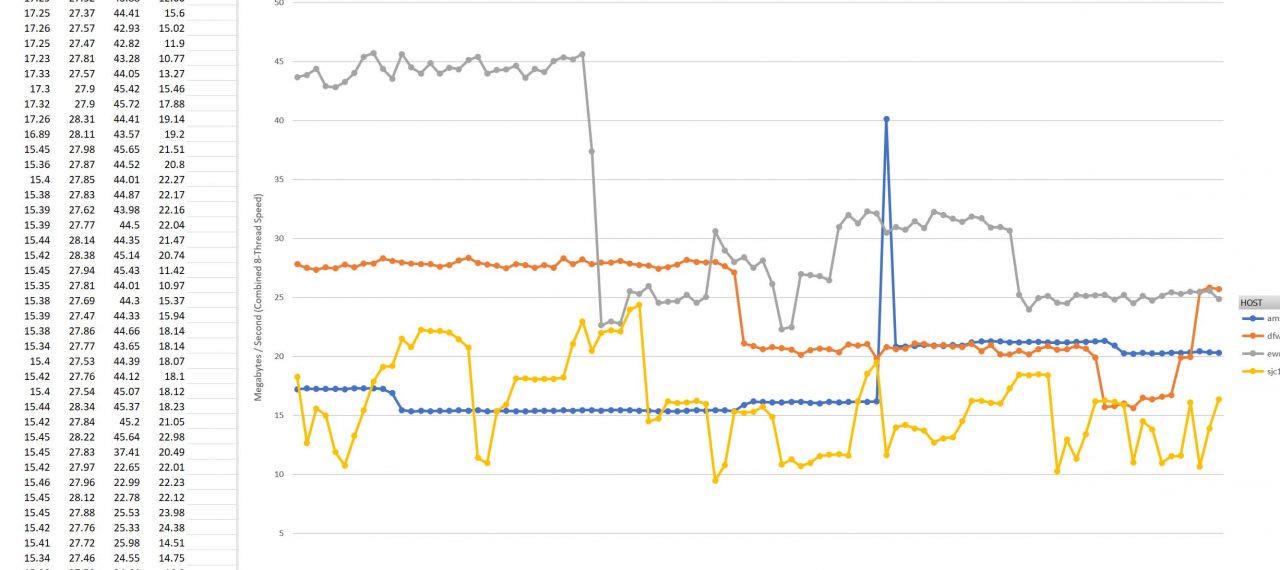
Check it out, the performance is definitely more indicative of what the DIA circuit is capable of now that we have all eight threads. This is in megabytes per second and is a little low, we would expect at least 80MB/s+, with a theoretical 125MB/s. Indeed at certain times we were getting those kind of speeds, even all the way to Amsterdam. However, my tests showed that speeds were consistently bad across all routes I was testing (to all four cities) at certain times of the day.
I installed “screen” and ran the speed.bash code in a separate backgrounded instance of bash for an extended period of time. I generated a ton of CSV formatted data which showed the performance over time.
[root@bfdstgp0001 ~]# yum -y install screen
Loaded plugins: fastestmirror
Loading mirror speeds from cached hostfile
 * base: mirror.cs.pitt.edu
 * epel: mirror.steadfastnet.com
...
[root@bfdstgp0001 ~]# screen
[root@bfdstgp0001 ~]# ./speed.bash >> /root/speed.log
Once you are in the screen and ran your command you can detach from the screen by pressing “CTRL+A”, letting go, then pressing “D”. To re-attach you can type “screen -x”. If you have multiple sessions you can specify an id, like “screen -x 12345”, it will show you a list of IDs if there is more than one when you type “screen -x”. To kill a screen an easy way is to attach to it, “CTRL+C” out of any running processes, and simply type “exit”. You’ll be back to your original non-screen bash session.
The speed.log file we’re generating is going to get filled with all the performance data we were talking about. This is great information to go to the ISP with since they’re going to have a hard time explaining why performance is bad to everywhere at the same time if it’s not them. We even made a little excel import of the data to show them against the CSV output.
It’s really just that easy to whip up your own monitoring solution for basic network throughput performance. Once you’re done testing, just nuke your instances at packet.com and you’re done paying for them. That’s the beauty and proper way of using cloud services for non-static loads.

Install latest PHP 5 on your CentOS server from source.
Pick random line from text file with bash and shuf.